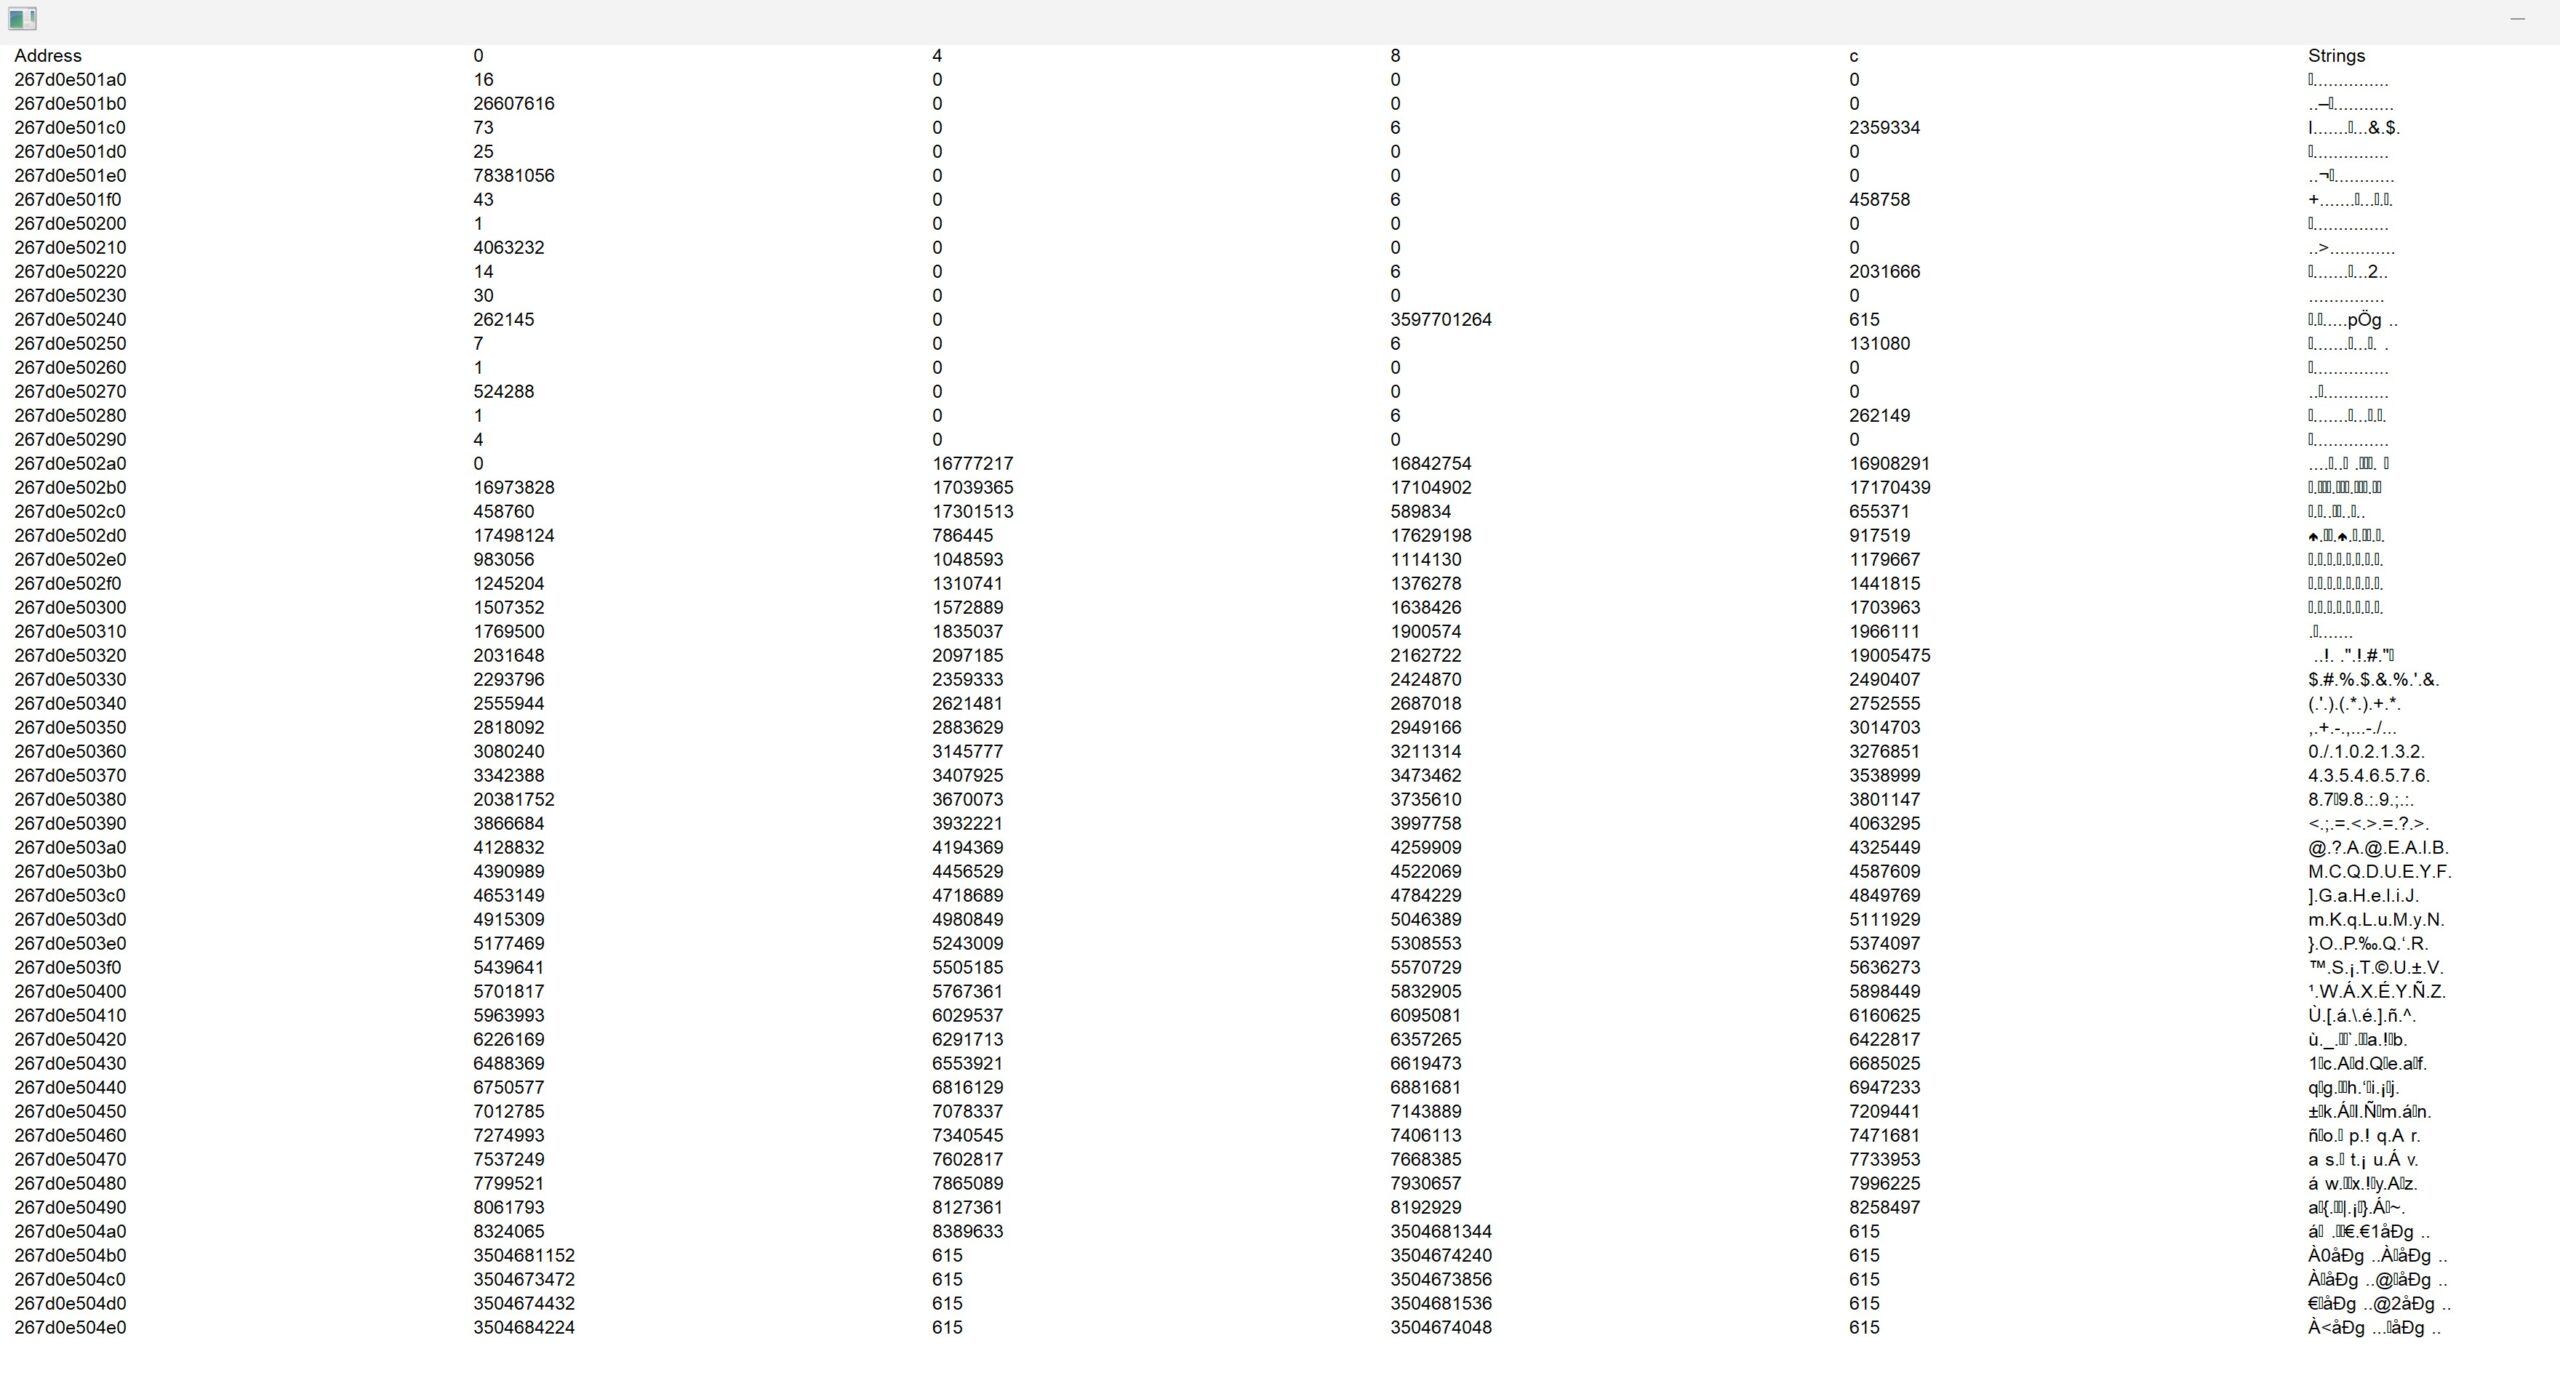
The Memory Viewing Window is where you can see all the memory around a specific address, organized by data type and columns. It is activated via the "mem" console command. The number of columns depends on the data type.

Settings
You can customize the Memory Viewing Window's appearance in config.txt on line 11, changing things such as font size & color, the width and height of the window, background color, etc. Each setting should be separated by the "|" character and follows a predetermined order:
- Window width.
- Window height.
- Window font size.
- Number of lines (i.e., the amount of text to show).
- Window background color.
- Window font color.
- Window X position.
- Window Y position.
- Window transparency. "1" enables transparency. "0" disables it. Note that a transparent console window cannot be clicked on, so if you want to input text into the console, you must select the window from the taskbar.
Example
1820|980|40|30|0|120000|0|0|0
Usage
- Right-clicking on any address in the left column will add it to the clipboard.
- Left-clicking on any value in any column will add the associated address to your saved addresses list.
- Left-clicking on a pointer (i.e., an address pointing to another address) while holding down left CTRL will move the memory viewing window to that address. (It will be as if you used the "mem -a" command on that address.) This is a great way to find nearby values you might want to hack.
- Scrolling is possible via the mouse, as well as PAGE UP & PAGE DOWN.